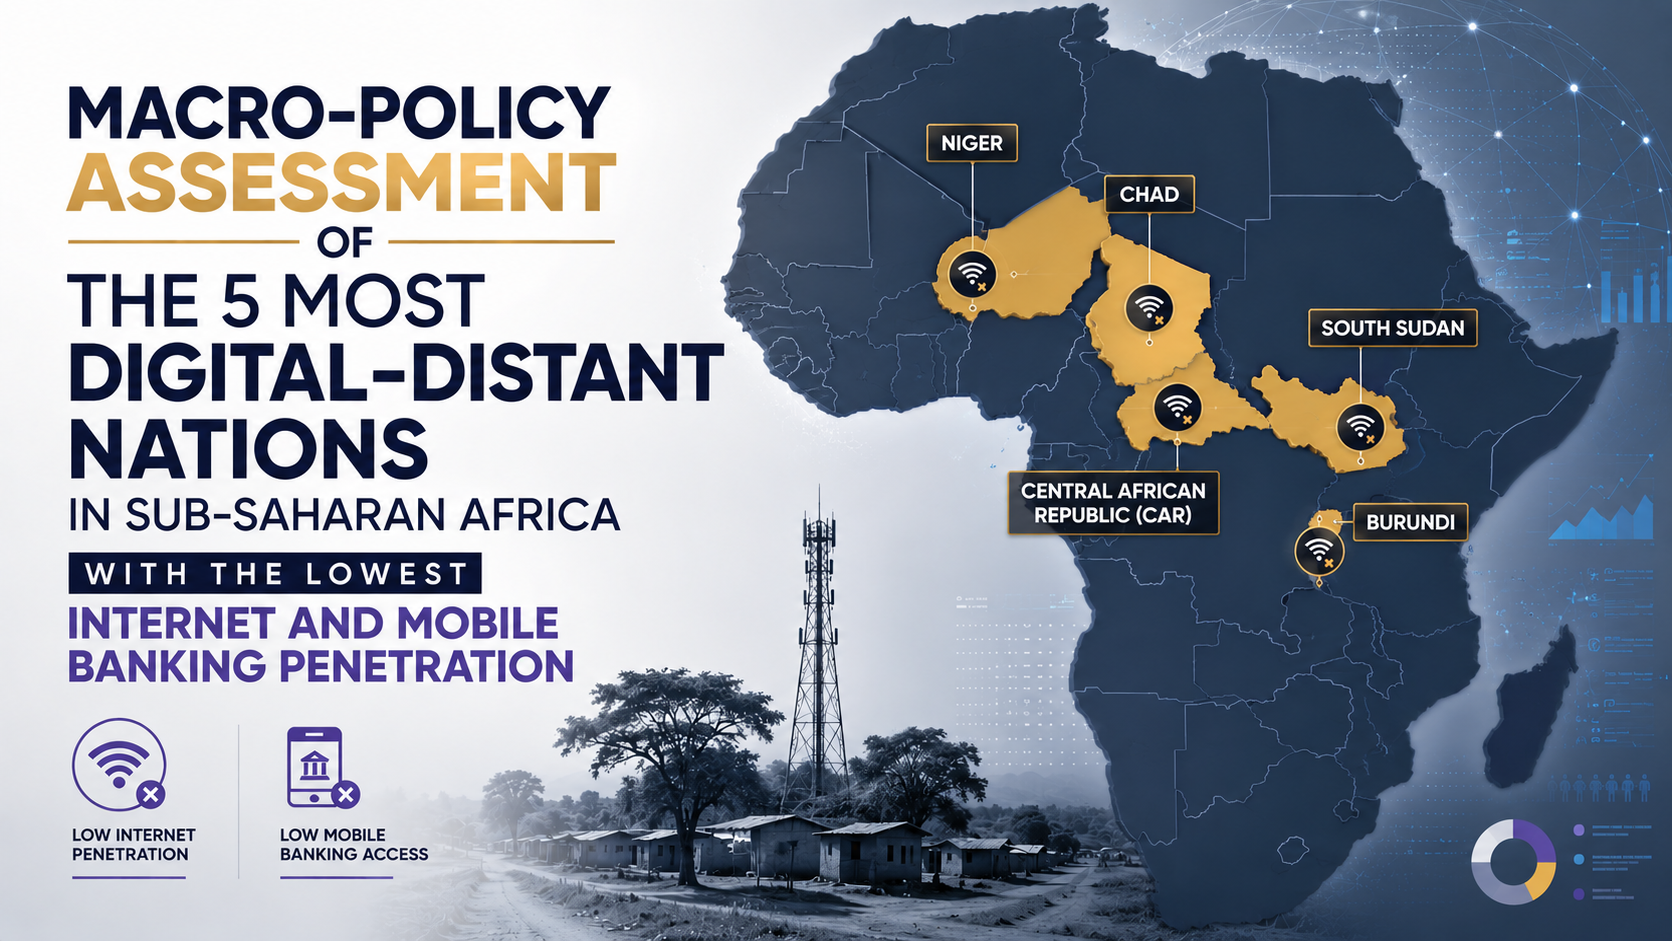
THE INFRASTRUCTURE AND FINANCIAL INCLUSION ABYSS: Macro-Policy Assessment of the 5 Most Digital-Distant Nations in Sub-Saharan Africa
Primary Data Frameworks: World Bank Global Findex Database, GSMA State of Mobile Internet Connectivity Report, International Telecommunication Union (ITU) ICT Development Index, UNDP Digital Wallet Analysis.
1. Executive Summary
While Sub-Saharan Africa is globally recognized as an engine for mobile money innovation—averaging an account ownership rate of nearly 56%—the continental aggregate masks a severe structural divide. While market leaders like Mauritius (90%), Kenya (90%), and South Africa (81%) approach universal financial access, a subset of landlocked, conflict-impacted, or infrastructure-deprived nations remains nearly isolated from the digital economy.
In the 5 lowest-ranked economies—South Sudan, Central African Republic (CAR), Niger, Burundi, and Chad—financial account ownership averages under 18%, with mobile banking and digital payment adoption hovering in single digits.
This report provides a structural, empirical analysis of these five nations. It examines the systemic root causes—from power grid collapse to rigid regulatory frameworks—and establishes an actionable roadmap for central banks and international multilateral funders.
2. The Structural Triad Driving Digital Exclusion
The failure of digital and mobile banking to scale in these jurisdictions is not merely a consumer preference issue; it is driven by three interconnected structural failures:
┌─────────────────────────────────────────────────────────────────────────────┐
│                 THE STRUCTURAL TRIAD OF DFS EXCLUSION                       │
├───────────────────────────────────┬─────────────────────────────────────────┤
│ 1. INFRASTRUCTURE & ENERGETIC GAP │ Total absence of grid power & fiber-optic│
│                                   │ backbones forcing high operator CAPEX.  │
├───────────────────────────────────┼─────────────────────────────────────────┤
│ 2. DEVICE & DATA AFFORDABILITY    │ Data costs exceeding 2% GNI per capita  │
│                                   │ threshold; low smartphone adoption.     │
├───────────────────────────────────┼─────────────────────────────────────────┤
│ 3. REGULATORY & IDENTITY GAP      │ Missing foundational ID protocols (KYC) │
│                                   │ & anti-competitive USSD gateway pricing.│
└───────────────────────────────────┴─────────────────────────────────────────┘
-
The Energy and Broadband Infrastructure Gap: Broad swathes of the population in these nations lack access to basic 3G/4G broadband networks, aggravated by national power grid electrification rates that remain below 20%. Telecom base transceiver stations (BTS) must run almost entirely on off-grid diesel generators, driving up operating costs.
-
Device Affordability and the “App-versus-USSD” Divide: Advanced internet banking requires smartphones, yet average smartphone adoption across these 5 nations sits below 25% (versus the global average of 76%). Furthermore, the cost of 1GB of mobile data consistently exceeds the United Nations Broadband Commission’s maximum target threshold of 2% of Gross National Income (GNI) per capita.
-
Identity (KYC) Deficits & Cash Dependency: Strict Know-Your-Customer (KYC) compliance mandates clash with the reality that over 50% of adults in these lagging markets lack official national identification documents, rendering them legally ineligible for formal financial onboarding.
3. Deep-Dive Profiles: Top 5 African Countries with Lowest Penetration
1. South Sudan
-
Financial Account Ownership: 6.0% (Lowest globally)
-
Mobile Money Account Penetration: < 1.0%
-
Internet Penetration: 10.9%
-
Data Cost relative to GNI: Exceeds 8.5% of monthly GNI per capita
South Sudan Inclusion Divide:
[██████                                            ] 6.0% Financial Account Ownership
[█                                                 ] <1.0% Mobile Wallet Usage
Core Policy & Economic Drivers:
-
Post-Conflict Infrastructure Destruction: Decades of civil insecurity have devastated physical power grids and telecommunications backbones. Network operators face frequent physical outages and severe security challenges in maintaining rural base towers.
-
Extreme Macroeconomic Volatility: A hyper-depreciating local currency (which lost over 90% of its value against the USD in recent years) has crippled trust in domestic digital currency ledgers. Cash (specifically physical USD and cash transfers) remains the primary store of value.
-
Documentary KYC Barriers: Over 59% of adults report complete financial exclusion, primarily because only 41% of citizens hold government-issued identification cards required to open bank or mobile money accounts.
2. Central African Republic (CAR)
-
Financial Account Ownership: 13.7%
-
Mobile Phone Ownership: 35.0%
-
Internet Penetration: 10.6%
-
Key Challenge: Severe lack of power supply and limited commercial bank agent networks
CAR Infrastructure Matrix:
• National Electrification Rate: < 15%
• Mobile Internet Coverage Gap:  > 60% of rural landmass
• Formal Commercial Bank Branches: concentrated strictly in Bangui
Core Policy & Economic Drivers:
-
Capital City Urban Concentration: Formal banking infrastructure is almost entirely concentrated within the capital, Bangui, leaving rural populations completely unserved by physical or digital financial access points.
-
Grid Failure & High OPEX: With a national electrification rate among the lowest globally, mobile network operators (MNOs) struggle to maintain operational uptime, directly impacting USSD and data-based mobile transaction routing.
-
Informal Liquidity Reliance: Ongoing security challenges encourage informal shadow financial networks over centralized, trackable digital ledgers.
3. Niger
-
Financial Account Ownership: 12.2% – 15.0%
-
Mobile Phone Ownership: 54.0%
-
Internet Penetration: 16.9%
-
Structural Bottleneck: Geographic footprint vs. low agent liquidity density
Niger Connectivity vs Access Disparity:
• Phone Ownership: 54.0% (Sufficient Baseline)
• Bank Account Access: 12.2% (Severe Policy Bottleneck)
Core Policy & Economic Drivers:
-
The “Phone-to-Account” Disparity: Niger presents a stark policy anomaly: 54% of the adult population owns a mobile phone, yet only 12.2% hold a financial account. This reveals that mobile ownership has not translated into digital banking uptake due to restrictive MNO licensing policies and high agent cash-out transaction taxes.
-
Vast Land Area & Low Agent Density: The geographic distribution of Niger’s population across vast desert terrain makes maintaining physical cash-in/cash-out (CICO) agent networks economically non-viable for traditional commercial banks.
-
Financial Literacy Deficit: High adult illiteracy rates severely reduce consumer confidence in navigating text-heavy USSD menus and smart banking applications.
4. Burundi
-
Financial Account Ownership: 18.0%
-
Mobile Money Penetration: 12.0%
-
Internet Penetration: 14.5%
-
Primary Bottleneck: High mobile internet tariffs relative to rural household incomes
Core Policy & Economic Drivers:
-
High Rural Population Density with Low Capitalization: While Burundi has high geographic population density, over 80% of its workforce relies on subsistence agriculture with minimal disposable income, restricting transaction volumes needed to sustain digital banking networks.
-
Foreign Exchange Constraints & Import Tariffs: High import duties on telecommunications hardware and low-cost smartphones keep internet-enabled devices out of reach for over 85% of households.
-
Restrictive Financial Sector Directives: Historic Central Bank regulations limited non-bank financial institutions from issuing e-money directly, slowing down early-stage fintech innovation compared to East African neighbors like Rwanda and Uganda.
5. Chad
-
Financial Account Ownership: 20.1% – 21.0%
-
Mobile Phone Ownership: 53.0%
-
Internet Penetration: 12.2%
-
Primary Bottleneck: High cost of data services relative to income levels
Chad Affordability Analysis:
• Cost of 1GB Data: ~ 11% of monthly average income
• UN Broadband Target: < 2.0% of monthly average income
• Gap Factor: 5.5x over affordable baseline
Core Policy & Economic Drivers:
-
Landlocked Broadband Routing Costs: Because Chad relies on transit fiber-optic links through neighboring countries (Cameroon and Sudan), wholesale bandwidth prices are among the highest in Africa, pricing low-income households out of mobile internet services.
-
High Device Tax Policies: Consumer import duties and luxury taxes on smartphones maintain a prohibitive cost barrier for entry-level devices, forcing citizens onto basic 2G voice-and-SMS feature phones.
-
Inadequate Interoperability Frameworks: National digital payment systems lack full seamless cross-network interoperability between commercial banks, microfinance institutions (MFIs), and MNO mobile wallets.
4. Comparative Multi-Variable Policy Matrix
| Country | Account Ownership (% Adults) | Mobile Phone Ownership (%) | Internet Penetration (%) | Primary Infrastructure / Policy Bottleneck |
| South Sudan | 6.0% | ~30.0% | 10.9% | Severe infrastructure destruction, lack of national IDs (41% coverage) |
| Central African Republic | 13.7% | ~35.0% | 10.6% | Power grid collapse (<15% access), acute rural agent absence |
| Niger | 12.2% | 54.0% | 16.9% | Severe phone-to-account gap, low CICO agent liquidity density |
| Burundi | 18.0% | ~45.0% | 14.5% | High hardware import tariffs, sub-15% smartphone adoption |
| Chad | 20.1% | 53.0% | 12.2% | Prohibitive broadband transit costs, lack of payment interoperability |
5. Actionable Strategic Roadmap for Policy Makers & DFIs
To transition these nations out of digital exclusion, policy makers, central bank regulators, and development funds must move away from standard fintech strategies and focus on foundational systemic interventions:
┌─────────────────────────────────────────────────────────────────────────────┐
│                      POLICY IMPLEMENTATION ARCHITECTURE                     │
├─────────────────────────────────────────────────────────────────────────────┤
│  STAGE 1: Tiered / Simplified KYC Regulation (Central Bank Action)          │
│  ➜ Allow basic mobile wallets without formal physical ID requirements.     │
├─────────────────────────────────────────────────────────────────────────────┤
│  STAGE 2: Zero-Rated USSD & Mandated Interoperability (Telecom Action)      │
│  ➜ Mandate open, affordable USSD access for non-bank fintech providers.    │
├─────────────────────────────────────────────────────────────────────────────┤
│  STAGE 3: Off-Grid Clean Energy & Infrastructure Subsidies (DFI Action)     │
│  ➜ Fund solar-powered base stations & lower hardware import duties.         │
└─────────────────────────────────────────────────────────────────────────────┘
A. Regulatory Modernization (Central Banks)
-
Implement Tiered KYC (Risk-Based Account Opening): Regulators must permit low-value digital wallets to be opened using alternative identity verification—such as biometric voter cards, local community attestations, or SIM card registration data—to bypass national identity document bottlenecks.
-
Mandate National Interoperability switches: Enforce open API standards connecting commercial banks directly to MNO mobile wallets, eliminating siloed walled gardens.
B. Telecom & Infrastructure Reform (Ministers of Tech & Regulators)
-
USSD Price Controls and Open Access: Classify USSD channels as essential national utility infrastructure. Cap the fees charged by telecom operators to financial institutions for routing financial USSD traffic.
-
Eliminate Taxes on Entry-Level Devices: Eliminate customs duties and import value-added tax (VAT) on smartphones costing under $30 USD to accelerate the transition from 2G feature phones to broadband-capable devices.
C. Strategic Capital Deployment (DFIs & Blended Finance)
-
Fund Solar Power for Telecom Infrastructure: Grant concessional loans and green infrastructure subsidies to telecom operators to convert off-grid diesel base stations to solar-hybrid systems, dramatically lowering network operational costs in rural regions.
-
Agent Network Liquidity Guarantees: Deploy blended finance credit facilities to underwrite cash-in/cash-out (CICO) agent networks in remote areas, guaranteeing liquidity for agents serving sparsely populated zones.
6. Verifiable Sources & Reference Documentation
-
World Bank Group: The Global Findex Database: Financial Inclusion, Digital Payments, and Mobile Tech in Sub-Saharan Africa.
-
World Bank Brief: Financial Inclusion in Sub-Saharan Africa—An Overview.
Link: worldbank.org/en/publication/globalfindex/brief/financial-inclusion-in-sub-saharan-africa-overview
-
GSMA Intelligence: The State of Mobile Internet Connectivity Report (Sub-Saharan Africa Region Focus).
-
UNDP South Sudan Research: Digital Mobile Wallet Usage as an Enabler for Financial Inclusion in South Sudan.
Link: undp.org/south-sudan/publications/digital-mobile-wallet-usage-enabler-financial-inclusion
-
MDPI Academic Press: Low Internet Penetration in Sub-Saharan Africa and Structural Connectivity Challenges.
Link: mdpi.com/2673-4001/7/1/7
-
African Development Bank (AfDB): Mobile Banking in Africa: Taking the Bank to the Unbanked Population.